Skills You Need to Succeed with
Project Management and 10 Essential
Dashboards to Boost Efficiency
See also: Project Management Skills
Managing multiple projects simultaneously can be overwhelming, especially when deadlines creep up, data gets lost, and you need help to show stakeholders progress. While project management dashboards can help you stay organized, it’s not just about having the right tools—it’s also about building the right skills. In addition to technical know-how, good project managers develop essential soft skills like communication, adaptability, and problem-solving to make the most of these dashboards.
A project management dashboard combines all your essential project details, allowing you to manage tasks, allocate resources, and collaborate more efficiently through easy-to-read visuals and real-time data. However, to truly harness their power, project managers must blend these tools with well-honed interpersonal skills.
Let’s explore how dashboards and skill development go hand in hand to enhance project outcomes.
Soft Skills You Need to Succeed with Project Management
Mastering dashboard tools isn’t enough to excel as a project manager. Developing critical soft skills can transform how effectively you lead your team and manage projects. Communication, thinking critically, and solving problems creatively are just as vital as any technical skill.
Strong communication ensures that all stakeholders understand your project’s goals and updates. Adaptability allows you to stay flexible in the face of unexpected changes, and problem-solving skills help you resolve bottlenecks that arise during the project lifecycle. Leadership and emotional intelligence also foster a productive team environment, ensuring everyone stays engaged and motivated throughout the project.
These soft skills work in harmony with the technical features of your project management tools, helping you go beyond tracking tasks and resources and enabling you to truly drive project success.
Key Features Every Project Management Dashboard Should Have
Certain features are essential to getting the most out of a project management dashboard. However, success in using these features also hinges on the soft skills you bring to the table.
Customization for Unique Needs
Personalizing your dashboard is crucial. It would help if you were flexible about adding, removing, or adjusting widgets and charts to highlight the metrics that matter most to you. For instance, a financial project may call for a budget tracking widget showing how funds are allocated and spent, while an IT project might prioritize task completion rates displayed on a burn-down chart.
However, creating a customized dashboard is more than just a technical task. It requires adaptability, as each project presents its unique challenges. A manager who can quickly adjust to team priorities, deadlines, or changes in stakeholder needs can use customization features to reflect real-time conditions better and maintain control over shifting project dynamics.
Interactive Visualization for Deeper Insights
A great dashboard provides an intuitive way to visualize complex data quickly. Interactive visuals like clickable Gantt charts or task progress bars allow project managers to drill down into specifics, filter information, and analyze trends over time.
Managers need strong analytical skills to interpret this information effectively. Analyzing data critically is about more than just observing it; it’s about identifying patterns and drawing actionable insights. Whether you’re pinpointing delays or recognizing resource bottlenecks, the ability to analyze the data on your dashboard enables sound decision-making.
Collaboration, Automation, and Efficiency
Modern dashboards are more than just data visualization tools. They streamline collaboration and automate workflows, reducing manual tasks and keeping everyone in sync.
Automated Data Refresh
Automated data refresh capabilities ensure your dashboard remains up to date with real-time insights, minimizing the risk of human error. This is particularly helpful for monitoring project budgets or timelines that shift frequently.
Seamless Team Collaboration
Dashboards also improve team collaboration. Integrated features like connecting with tools like Slack allow team members to share updates and communicate within the platform. This smooths teamwork and fosters effective communication—an essential skill in project management. Whether you’re keeping stakeholders informed or aligning your team on the next steps, the ability to convey updates clearly and concisely is critical for keeping everyone on the same page.
Embedding Options for Accessibility
You may want to embed your dashboard in other platforms, such as company intranets or project management tools like Jira, enabling easy access for all team members. Accessibility is key, but ensuring everyone understands and utilizes the dashboard effectively is leadership and empathy. Being able to guide your team and help them know how to make the most of these tools is vital for smooth adoption.
Drilldowns for Problem-Solving
Sometimes, project managers need to dive deeper into a specific issue. Drilldown features let you click on a metric, such as a delayed milestone, and investigate the underlying cause. This feature empowers managers to break down complex problems into smaller, more manageable pieces.
But solving these issues requires more than technical tools; it also requires strong problem-solving skills. Analyzing the situation, understanding its root cause, and identifying a clear path forward separates an effective project manager from the rest. The drill-down feature enables the investigation, but your problem-solving abilities ultimately drive solutions.
Enhancing Your Efficiency with Dashboards and Skills
While the technical features of project management dashboards are indispensable, they truly shine when combined with the development of key soft skills. By enhancing your adaptability, communication, analytical thinking, and problem-solving abilities, you’ll use your dashboard more effectively and boost your overall project management capabilities. These skills allow you to lead with clarity, solve challenges proactively, and foster strong collaboration within your team.
Whether you're tracking progress, managing resources, or keeping stakeholders informed, dashboards are powerful allies—but only when used in conjunction with your growing expertise in project management’s human side.
Project Management Dashboard Examples
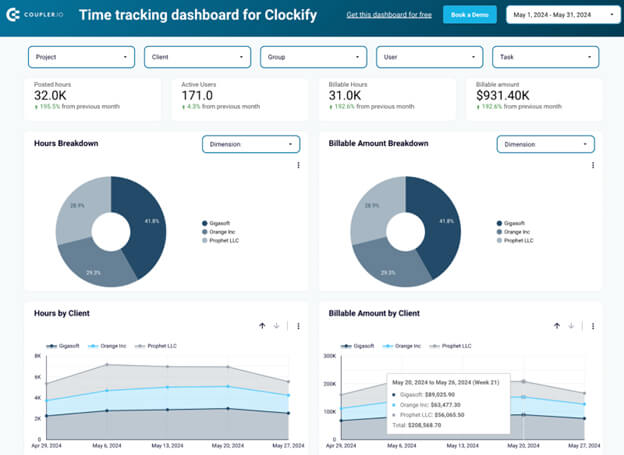
1. Time Tracking Dashboard for Clockify
The time-tracking dashboard for Clockify is perfect for teams that use Clockify to monitor time spent on various projects, clients, and tasks. It helps you manage work more effectively and increase productivity.
It allows you to easily see billable hours, active users, and how much time your team spends on different tasks. Additionally, it helps identify employee workload, making it easier to balance tasks and prevent overwork or underwork.
Data sources: Clockify account
BI tools used: Looker Studio, Google Sheets
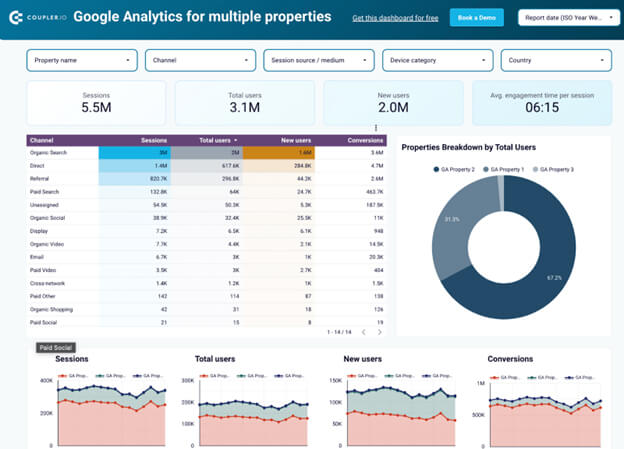
2. Google Analytics Dashboard for Multiple Websites
This Google Analytics (GA4) dashboard is ideal for managing multiple websites or apps. It provides an overview of sessions, users, new users, and average engagement time across all your properties, helping you track performance in one central place.
It consolidates data from various GA4 properties, making comparing performance across websites or apps easy. For instance, a marketing agency can track traffic across all client sites in one place.
Data sources: Google Analytics 4
BI tools used: Looker Studio
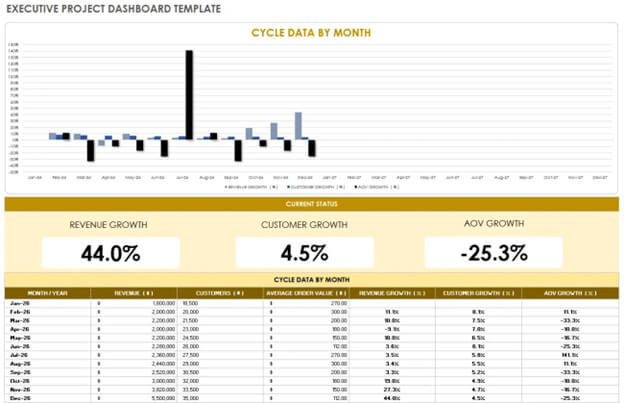
3. Project Management Executive Dashboard
The executive dashboard offers a high-level view of project performance, allowing executives to make informed decisions quickly and efficiently.
It’s designed for executives to monitor key project metrics, identify issues early, and allocate resources effectively. It also helps communicate progress to stakeholders.
Types of visualization used: Bar charts for budgets, line graphs for project progress, and pie charts for resource distribution.
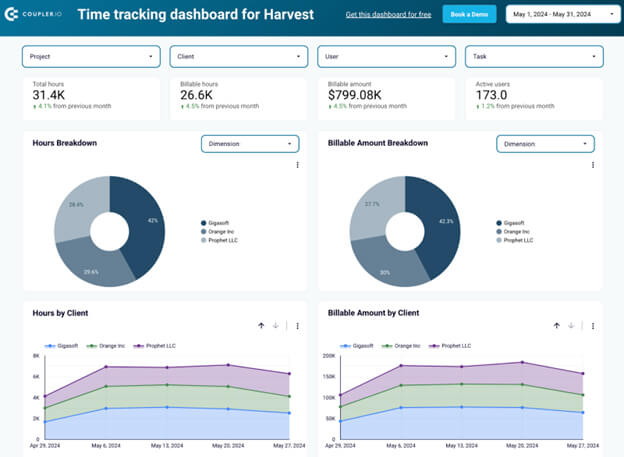
4. Time Tracking Dashboard for Harvest
For teams using Harvest to track time and expenses, the Harvest time-tracking dashboard offers insights into how time and money are spent on various projects and clients.
It provides a clear view of billable and total hours worked, helping you understand project profitability. You can also track which clients bring in the most revenue.
Data sources: Harvest account
BI tools used: Looker Studio, Power BI
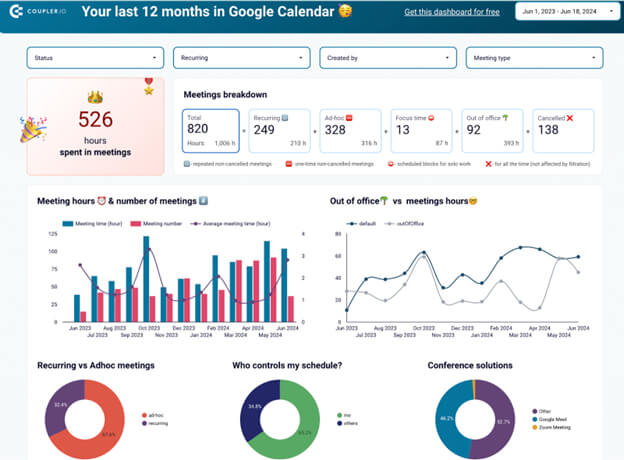
5. Google Calendar Dashboard
Meetings are an integral part of project management, and the Google Calendar Dashboard helps you evaluate your time spent in meetings. It tracks recurring and ad-hoc meetings, allowing you to manage your schedule better.
It breaks down how much time you spend in meetings and highlights the most common types, helping you assess their effectiveness.
Data sources: Google Calendar account
BI tools used: Looker Studio
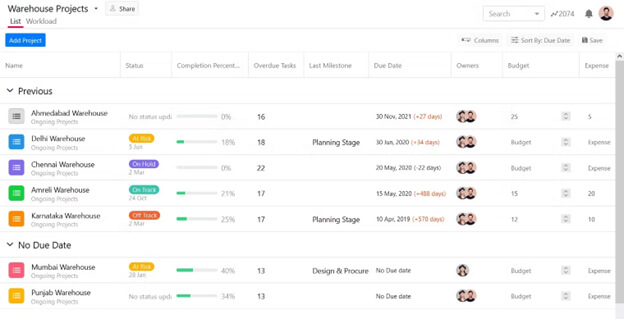
6. Multiple Project Management Dashboard
Managing several projects at once? The multiple project management dashboard lets you track progress, identify issues early, and allocate resources across different projects.
It provides a bird’s-eye view of multiple projects, helping you stay on top of your tasks and prioritize effectively.
Types of visualization used: This dashboard features charts and graphs to visualize project status, task completion, and budget tracking.
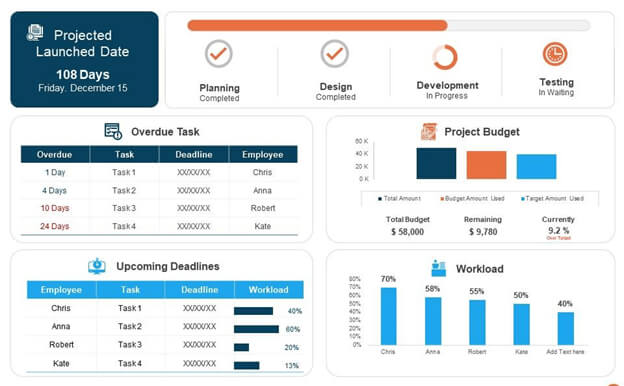
7. Project Management KPI Dashboard
Tracking key performance indicators (KPIs) is crucial in project management, and the KPI dashboard helps ensure you meet deadlines and manage resources efficiently.
It helps you monitor project progress and spot potential issues early, making it easier to manage budgets and timelines.
Types of visualization used: Bar charts for workload and budget data, progress bars for project phases, and tables for tasks and deadlines.
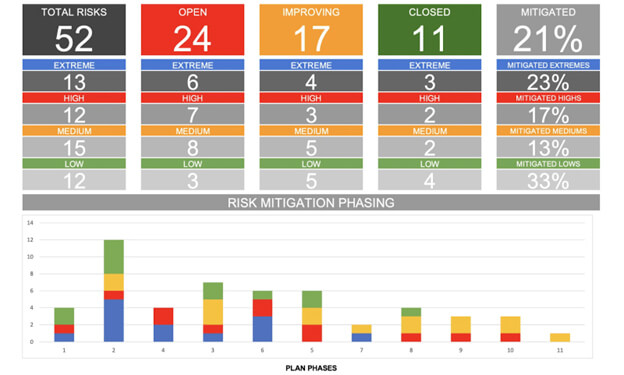
8. Project Risk Management Dashboard
This dashboard is essential for identifying, assessing, and managing project risks. It gives project managers and risk teams an overview of potential issues, allowing for timely action.
It helps track risk levels and status, mitigating risks to improve project outcomes.
Visualization types used: Bar charts for risk mitigation summary boxes for risk counts by severity.
9. Issue Tracker Dashboard
This dashboard helps track and resolve project issues. It’s perfect for teams focused on quick problem-solving and project health.
It monitors the number of created and resolved issues, helping improve project timelines and resolution speed.
Types of visualization used: Line charts for issue tracking, pie charts for status breakdown, and summary boxes for resolution times.
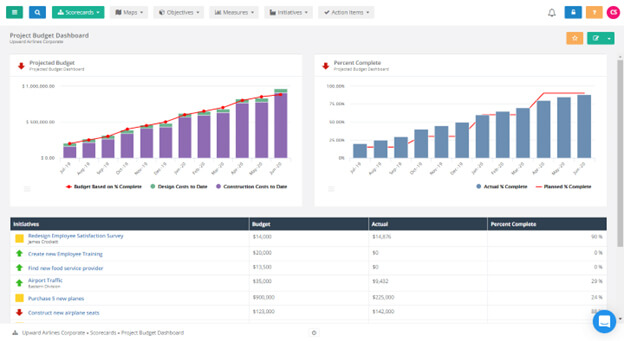
10. Project Budget Dashboard
This dashboard tracks and compares your project budget to actual spending, giving you a clear view of your project’s financial health.
It helps project managers and finance teams monitor budget deviations and spending patterns, ensuring projects stay on track financially.
Types of visualization used: Bar charts for budget versus actual costs, line graphs for project completion, and tables for spending data.
Conclusion
In conclusion, project management dashboards are powerful tools that enhance efficiency by providing clear, real-time insights into your projects. With the ability to track progress, allocate resources, and collaborate seamlessly, these dashboards help keep teams on track and ensure stakeholders are always informed. By choosing the right dashboard for your needs, you can streamline your workflow and ensure success across all your projects.
About the Author
Stefan Jovanovic is a Marketing Specialist at Coupler.io, a data analytics and reporting platform. Passionate about exploring various marketing tactics and outreach strategies, he has demonstrated his ability to craft successful marketing initiatives that drive engagement, generate leads, and increase conversion rates. Stefan is also a multifaceted creative interested in photography, social media, and writing.

